 飞鱼博客
飞鱼博客随着迷恋上各种服务自建,买了几台vps,配置都很低,动不动就出问题,等到使用的时候才发现服务坏掉了,我意识到一个监控服务是必须的。
在我的职业生涯中,linux监控服务使用过监控宝,后来是nagios,zabbix。
但是这两个东西的界面都非常简陋,甚至有些丑。
直到一个群友给我推荐了Prometheus+Grafana:
Grafana是什么
Grafana是一跨平台的开源的可视化分析工具,目前网络架构和应用分析中最流行的时序数据展示工具,主要用于 大规模指标数据的可视化展示。 快速灵活、易用性强的客户端图表,丰富的仪表盘插件,让复杂的数据更加直观。
简单来说,grafana是一个界面,数据通过api接口读取展示
这里用的数据源是Prometheus,当然,其他的监控工具也可以使用grafana作为界面使用,但是相对来说prometheus占用资源更少
Prometheus 是什么
现在最常见的 Docker、Mesos、Kubernetes 容器管理系统中,通常会搭配 Prometheus 进行监控。
Prometheus [prəˈmiθju:s] 普罗米修斯 Prometheus 基本原理是通过 HTTP 协议周期性抓取被监控组件的状态,这样做的好处是任意组件只要提供 HTTP 接口就可以接入监控系统,不需要任何 SDK 或者其他的集成过程。这样做非常适合虚拟化环境比如 VM 或者 Docker 。
输出被监控组件信息的 HTTP 接口被叫做 exporter。
目前互联网公司常用的组件大部分都有 exporter 可以直接使用,比如 Varnish、Haproxy、Nginx、MySQL、Linux 系统信息 (包括磁盘、内存、CPU、网络等等),具体支持的源看:https://github.com/prometheus。
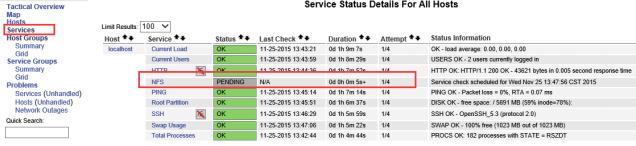
exporter ([ekˈspɔ:tə(r)] 出口商)对比主流的监控工具的操作界面:nagios 监控界面:
zabbix 监控界面
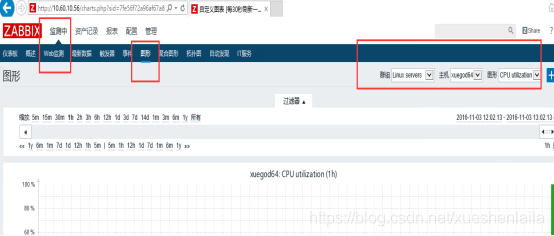
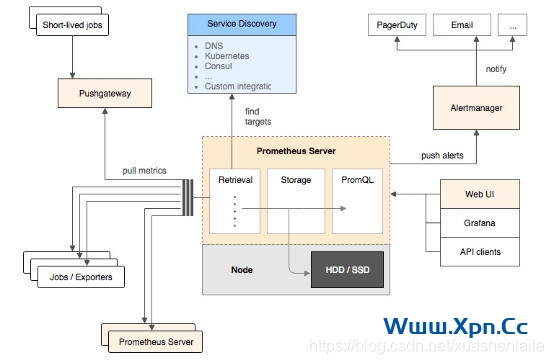
通过上面的界面,我们可以看出来 Grafana+Prometheus 展示界面更美观 1.1.2 Prometheus 架构图解普罗米修斯(Prometheus)及其一些生态系统组件的整体架构:
搭建过程
主服务器安装Prometheus+Grafana
操作系统:Centos7.6
安装Prometheus
Prometheus 项目主页:https://github.com/prometheus/prometheus/
根据自己的操作系统选择合适的包
# 查看操作系统版本
cat /etc/os-release

#NAME="CentOS Linux"
#VERSION="7 (Core)"

yum update
yum install wget

# 下载prometheus
wget https://github.com/prometheus/prometheus/releases/download/v2.40.2/prometheus-2.40.2.linux-amd64.tar.gz
tar zxf prometheus-2.40.2.linux-amd64.tar.gz -C /opt
mv /opt/prometheus-2.40.2.linux-amd64 /opt/prometheus
配置开机启动
vim /usr/lib/systemd/system/prometheus.service
# content #
[Unit]
Description=prometheus service

[Service]
User=root
ExecStart=/opt/prometheus/prometheus --config.file=/opt/prometheus/prometheus.yml --storage.tsdb.path=/opt/prometheus/data

TimeoutStopSec=10
Restart=on-failure
RestartSec=5

[Install]
WantedBy=multi-user.target
启动服务
systemctl daemon-reload
systemctl enable prometheus --now
systemctl status prometheus
开启防火墙端口9090
# 如果防火墙未开启就不用打开端口了#
firewall-cmd --zone=public --add-port=9090/tcp --permanent
firewall-cmd --reload
浏览器里访问 http://ip:9090
安装Grafana
设置官方源
vim /etc/yum.repos.d/grafana.repo
[grafana]
name=grafana
baseurl=https://packages.grafana.com/oss/rpm
repo_gpgcheck=1
enabled=1
gpgcheck=1
gpgkey=https://packages.grafana.com/gpg.key
sslverify=1
sslcacert=/etc/pki/tls/certs/ca-bundle.crt
如果是国内服务器最好是设置中文源
vim /etc/yum.repos.d/grafana.repo[grafana]
name=grafana
baseurl=https://mirrors.tuna.tsinghua.edu.cn/grafana/yum/rpm
repo_gpgcheck=0
enabled=1
gpgcheck=0安装
yum makecache -y
yum install grafana -y
systemctl daemon-reload
systemctl enable grafana-server --now
systemctl status grafana-server
开启防火墙端口3000
# 如果防火墙未开启就不用打开端口了#
firewall-cmd --zone=public --add-port=3000/tcp --permanent
firewall-cmd --reload
浏览器里访问 http://ip:3000
默认用户名密码都是admin,初次登录会要求修改默认的登录密码:

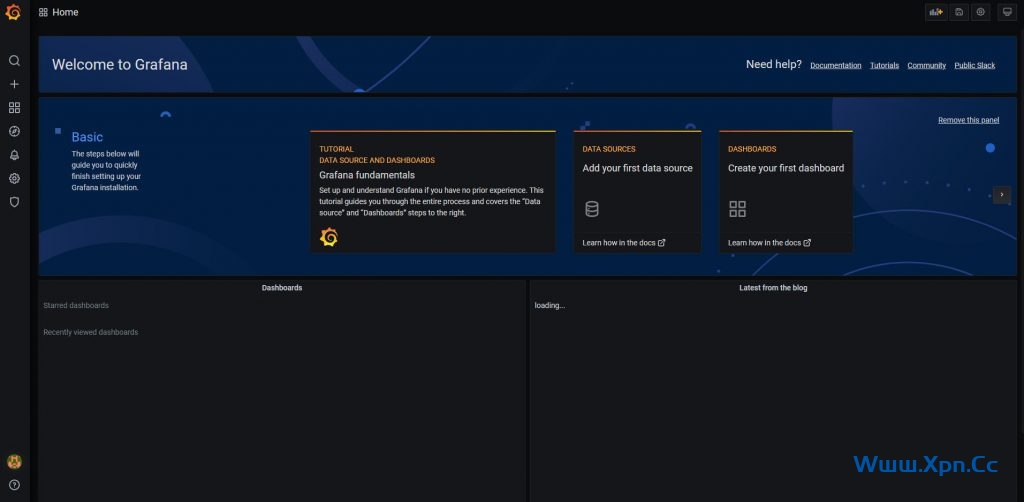
添加Prometheus数据源
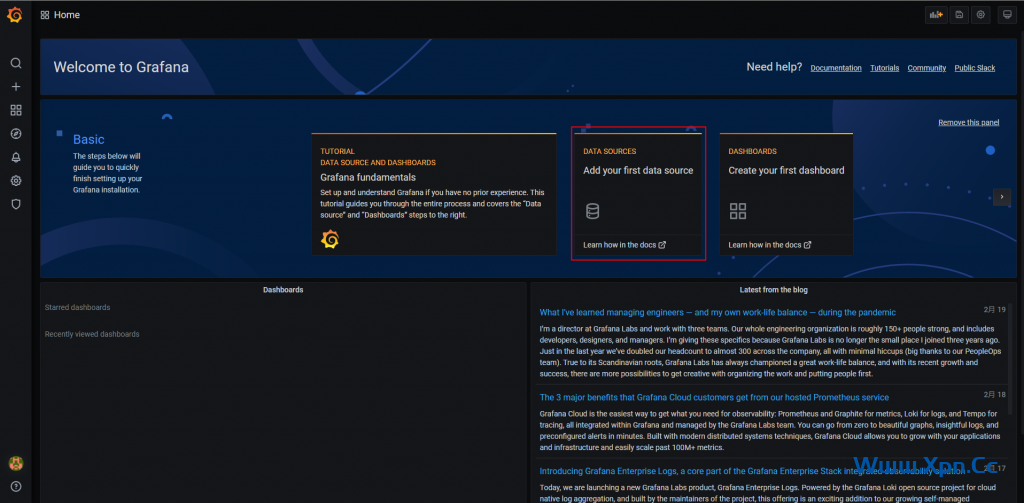
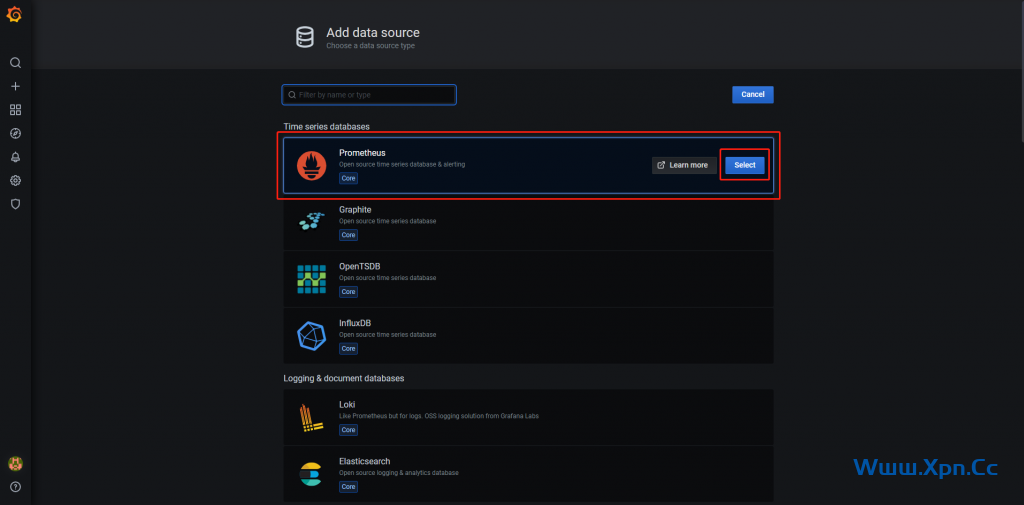
点击主界面的“Add your first data source”并选择Prometheus:
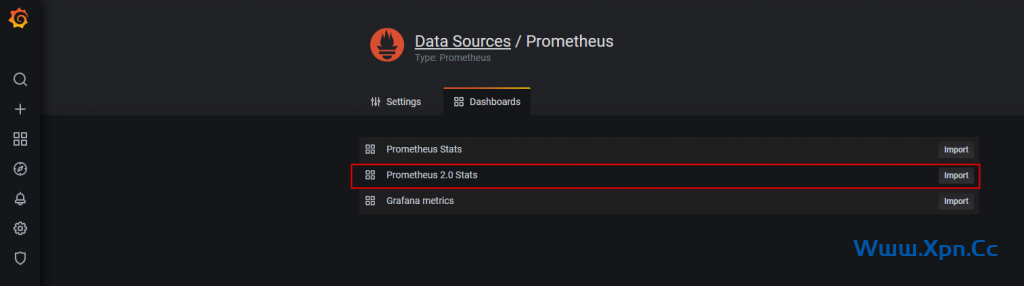
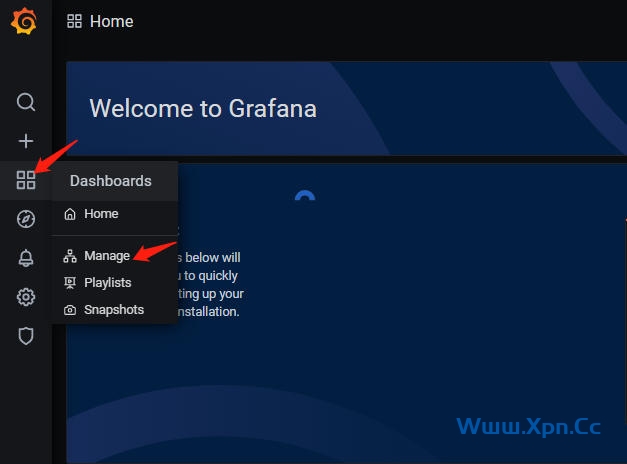
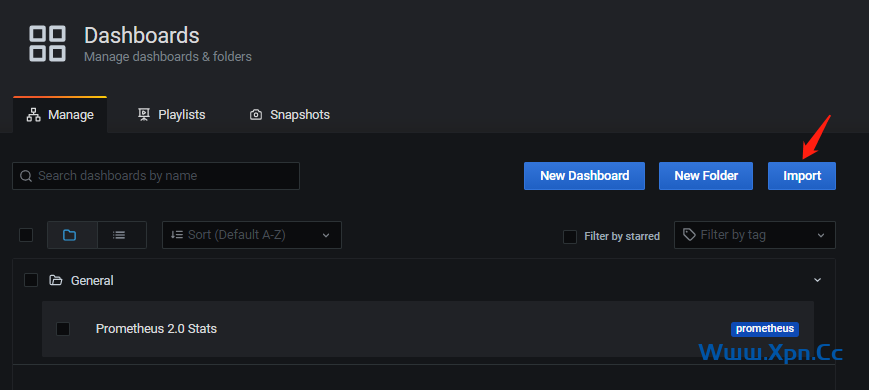
Dashboards页面选择“Prometheus 2.0 Stats”进行Import:
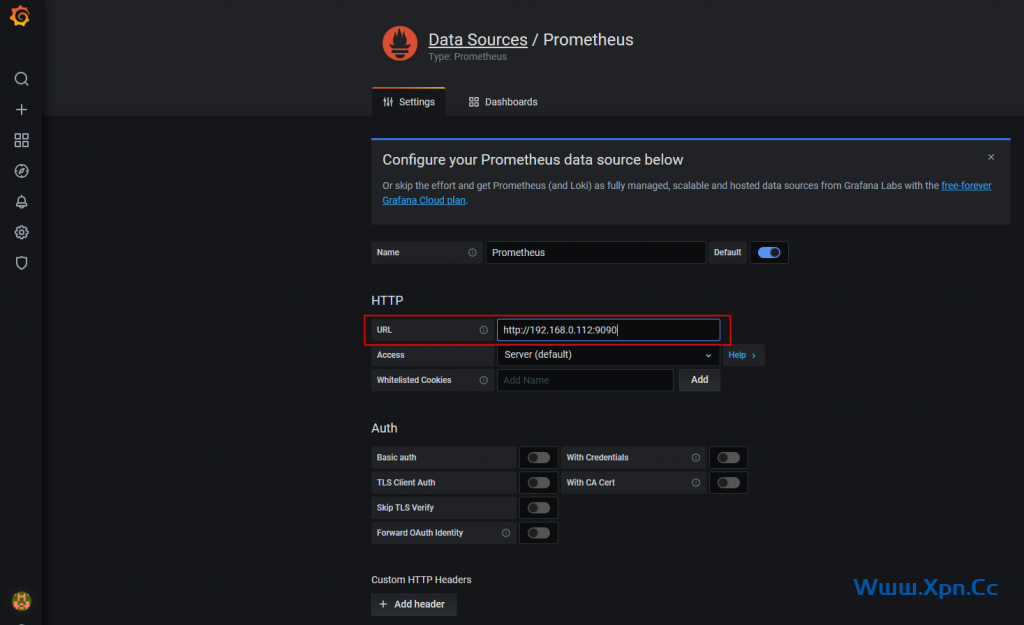
Settings页面填写普罗米修斯地址并保存:
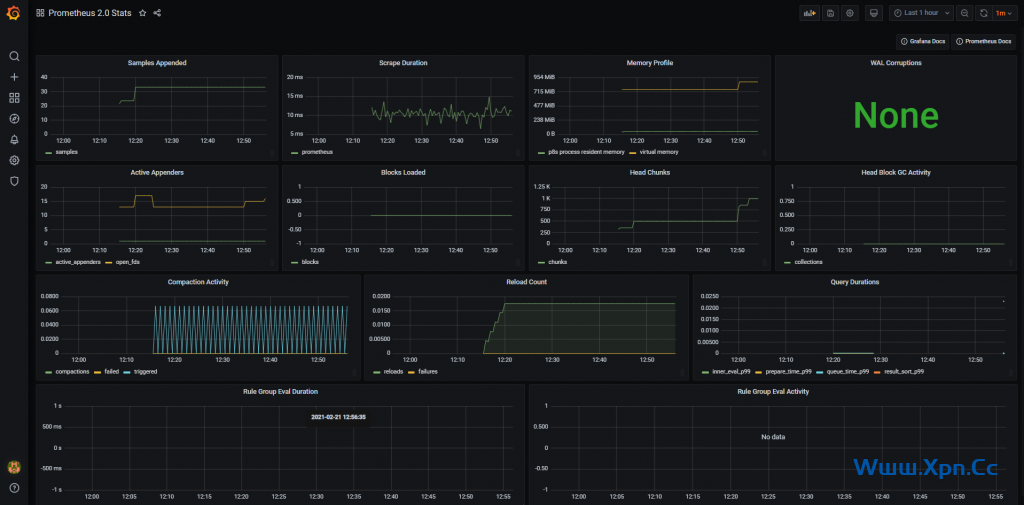
切换到我们刚才添加的“Prometheus 2.0 Stats”即可看到整个监控页面:
安装配置 node_exporter
这是被监控端需要安装的,因为主服务器本身也要监控,所以也要安装
项目主页:https://github.com/prometheus/node_exporter
wget https://github.com/prometheus/node_exporter/releases/download/v1.4.0/node_exporter-1.4.0.linux-amd64.tar.gz
tar xf node_exporter-1.4.0.linux-amd64.tar.gz -C /opt/

mv /opt/node_exporter-1.4.0.linux-amd64/ /opt/node_exporter
创建 node_exporter 系统服务启动文件
vim /usr/lib/systemd/system/node_exporter.service
#Prometheus Node Exporter Upstart script
[Unit]
Description=Node Exporter
Wants=network-online.target
After=network-online.target

[Service]
User=root
ExecStart=/opt/node_exporter/node_exporter

[Install]
WantedBy=default.target
启动node_exporter
systemctl daemon-reload
systemctl enable node_exporter --now
systemctl status node_exporter
# 服务启动后可以用 http://localhost:9100/metrics
# 如果防火墙未开启就不用打开端口了#
firewall-cmd --zone=public --add-port=9100/tcp --permanent
firewall-cmd --reload浏览器里访问 http://ip:9100/metrics 测试 node_exporter 是否获取到节点的监控指标。
Prometheus配置文件添加监控项:
vim /opt/prometheus/prometheus.yml
# 务必注意格式,多少个空格就是多少个空格,不然会报错。
  - job_name: 'linux-master'
    static_configs:
    - targets: ['localhost:9100']
      labels:
        instance: linux-master
重启prometheus
systemctl reload prometheus.service回到Grafana的主界面,grafana导入画好的dashboard:
下载json文件:https://picture-bed-iuskye.oss-cn-beijing.aliyuncs.com/prometheus/node-exporter_rev5.json
其他的exporter:
https://cloud.tencent.com/document/product/1416/56041
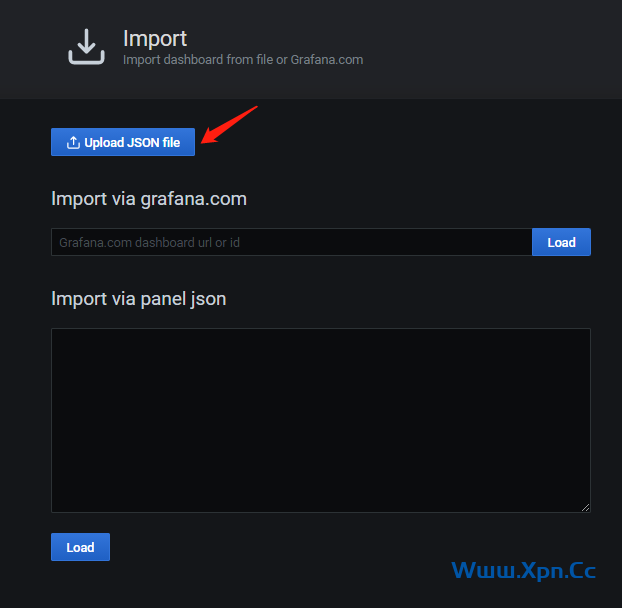
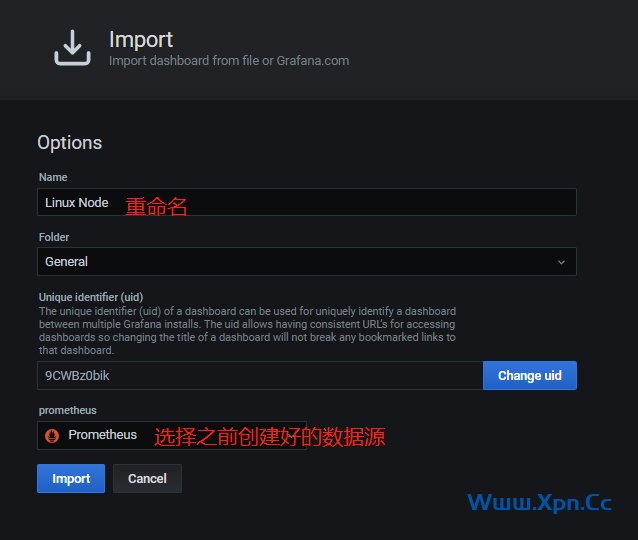
修改名字,选择我们前文创建好的数据源,点击导入即可:
下面这个提示是grafana缺少相关显示需要用到的插件piechart,grafana的默认插件目录是/var/lib/grafana/plugins,可以将下载好的插件解压到这个目录,重启grafana即可
安装插件
grafana-cli plugins install grafana-piechart-panel
grafana-cli plugins install digiapulssi-breadcrumb-panel
grafana-cli plugins install grafana-polystat-panel

systemctl restart grafana-server
查看已安装插件:
/usr/sbin/grafana-cli plugins ls
installed plugins:
grafana-piechart-panel @ 1.3.3
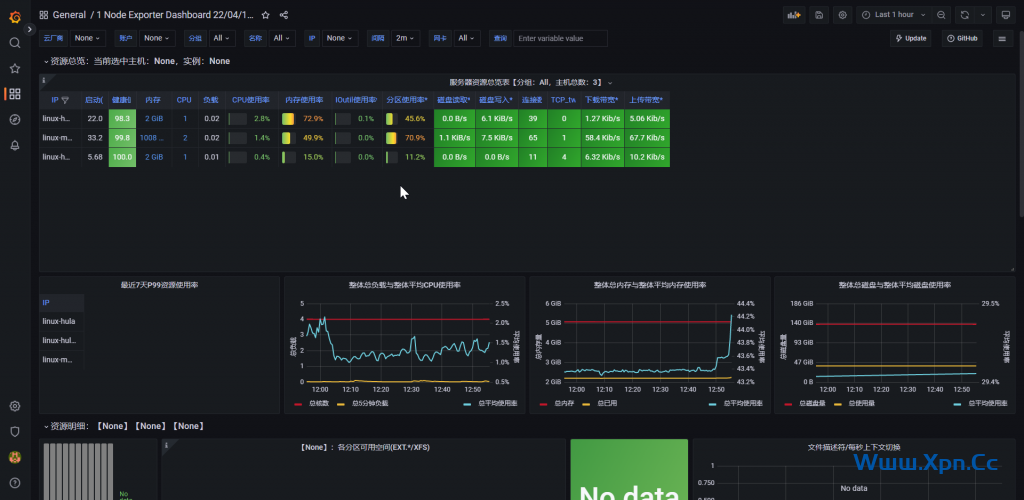
再刷新grafana页面,即可看到我们刚才设置好的node监控:
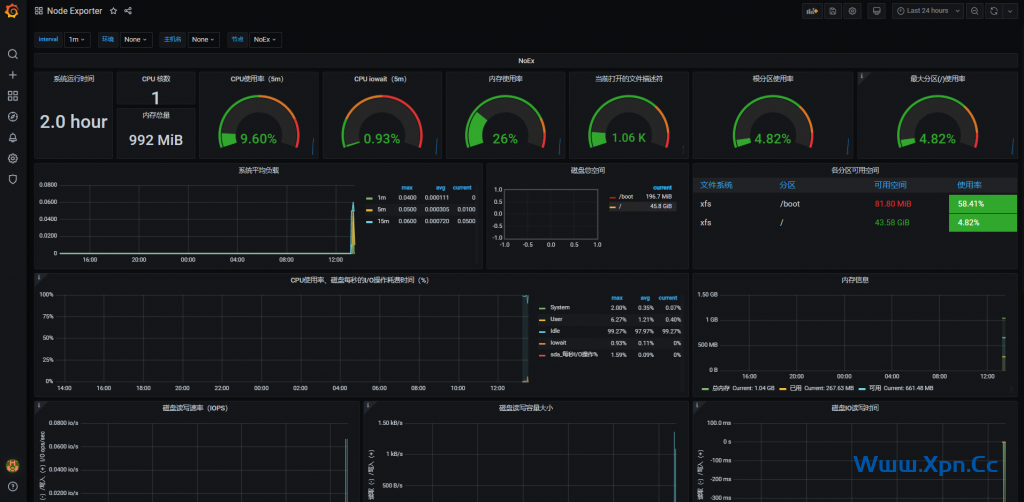
被监控主机:
其他被监控vps只需要安装node_exporter
打开防火墙,允许服务器访问Prometheus 端口
firewall-cmd --permanent --add-rich-rule="rule family="ipv4" source address="Pro主机的ip" port protocol="tcp" port="9090" accept"
firewall-cmd --reload
去grafana添加数据源
同上